Fibre Grew 22% Last Year - So Why Did SA Fall 13 Places in the World Rankings?
Icasa's State of the ICT Sector Report shows SA fibre subscriptions passed 3 million in 2025, up 22% - but entry-level fixed broadband is now the least affordable in BRICS, and South Africa's global fixed-broadband ranking fell 13 places to 115th of 152 countries. Here's what the regulator's own numbers mean for your bill.
In this article(9)
- 01A regulator's report card, and a mixed one
- 02What Icasa's State of the ICT Sector Report actually measures
- 03The growth numbers: fibre's genuinely good year
- 04The gap nobody markets: homes passed vs. homes actually connected
- 05Why fibre still costs what it costs: the BRICS affordability problem
- 06The 13-place drop: what SA's global broadband ranking actually reflects
- 07What this actually means if you're buying fibre right now
- 08Bottom line
- 09Frequently asked questions
A regulator's report card, and a mixed one
Once a year, the Independent Communications Authority of South Africa (Icasa) publishes what amounts to the industry's own report card: the State of the ICT Sector Report, a data-heavy audit of exactly how much South Africans are paying for connectivity, how much operators are investing, and how the country stacks up against the rest of the world. This year's edition, covering the 2025 calendar year, was released on 31 March 2026 - and it's been getting fresh attention through July as analysts and industry commentators work through what the numbers actually mean.
For anyone shopping for or already paying for fibre, the report is worth reading past the headline growth figures. Fibre had a genuinely strong year by the numbers: subscriptions crossed 3 million, up 22% on 2025's opening base, and fixed-network investment rose while mobile investment fell for the first time in years. But the same report also shows South Africa's fixed-broadband market falling 13 places in a global affordability and quality ranking, and confirms that entry-level fixed broadband pricing here is now the least affordable of any BRICS country. Both things are true at once, and understanding why is genuinely useful if you're deciding whether to sign up, switch, or negotiate on your current fibre bill.
What Icasa's State of the ICT Sector Report actually measures
Icasa is South Africa's telecoms and broadcasting regulator, and the State of the ICT Sector Report is its own account of the market it oversees - compiled from operator submissions, its own market monitoring, and independent benchmarking data. It covers mobile and fixed voice, data and broadband across the board, not just fibre, which is part of why the fibre-specific numbers can get lost in the headline sector-wide figures.
The top-line finding this year was blunt: South Africa's ICT sector grew just 0.8% overall in 2025, and essentially all of that growth came from connectivity - fixed and mobile data - rather than from voice services, which continued shrinking. SMS revenue alone collapsed 37.9% in a single year, and prepaid messaging revenue fell nearly 50%, a reminder of how completely data has replaced traditional telecoms revenue. Within that connectivity-driven growth, fixed broadband - meaning fibre and fixed-wireless home internet - was the standout performer, and that's the part of the report most relevant here.
The growth numbers: fibre's genuinely good year
Start with what went right. Fibre subscriptions crossed 3.01 million during 2025, a 22% increase - one of the strongest growth rates anywhere in the report. Fixed-wireless access (FWA), the router-based alternative to fibre offered by MTN, Vodacom and others, grew even faster in percentage terms, up roughly 40% as operators leaned harder into it for areas fibre hasn't reached yet. Fixed internet and data revenue rose 16.2% for the year.
Investment patterns told an even clearer story about where operators see the market heading. Fixed or wired network investment increased 11.9%, while mobile network investment fell 21% over the same period - a genuine pivot of capital toward fixed broadband infrastructure, even as total telecommunications investment across the sector fell to R28.4 billion, its third consecutive annual decline.
| Metric | 2024/25 | 2025/26 | Change |
|---|---|---|---|
| Fibre subscriptions | ~2.47 million | ~3.01 million | +22% |
| Fixed internet & data revenue | - | - | +16.2% |
| Fixed-wireless access (FWA) subscriptions | - | - | ~+40% |
| Fixed/wired network investment | - | - | +11.9% |
| Mobile network investment | - | - | -21.0% |
| Total telecom infrastructure investment | - | R28.4 billion | 3rd straight year of decline |
That's consistent with what this site's own coverage has been tracking all year - MTN's 30%-by-2030 home connectivity push, fresh entrants and price moves across every major network, and smaller fibre network operators outscoring the giants on service quality. Icasa's numbers are the sector-wide confirmation: fibre and FWA are where South African telecoms growth actually lives right now.
The gap nobody markets: homes passed vs. homes actually connected
Here's the number that matters most if you're trying to work out whether fibre is realistically an option for you: fibre networks in South Africa now pass roughly 5.4 million homes, about 28% of all households in the country. That's "passed," meaning the physical fibre infrastructure exists in the street or building, not that anyone has actually signed up.
The connected figure is smaller. Icasa's report puts fixed internet access - fibre plus other fixed broadband technologies combined - at only around 17.4% of South African households. In other words, even in areas where fibre infrastructure already exists, a meaningful share of homes that could get connected haven't. Individual operators tell a similar story at smaller scale: Telkom's Openserve, for example, reported roughly 1.5 million homes passed with a "market-leading" 52% connection rate in its most recent interim results - meaning even the network with the best conversion rate in the industry still isn't reaching every home it's built past.
Why the gap? It isn't usually about fibre being unavailable - it's a mix of upfront installation friction, unfamiliarity with which of the dozens of ISPs reselling the same network actually offers the best deal at a given address, and, as the next section covers, genuine affordability pressure at the entry-level end of the market. If you've never actually run a coverage check at your address because you assumed fibre "isn't there yet," this is the number that says it's worth checking - see our fibre coverage map to find out what's actually available on your street before assuming otherwise.
Why fibre still costs what it costs: the BRICS affordability problem
The report's most pointed finding is about price. Icasa calculated that entry-level fixed broadband in South Africa costs around R309 a month - 66% above what it considers an affordable benchmark for the local income distribution. Within the BRICS bloc (Brazil, Russia, India, China and South Africa, now expanded to include several other economies), the report found South Africa competitive on mobile data pricing but the least affordable of the group specifically for fixed broadband.
That's a genuinely different story to mobile. South African mobile data pricing has improved substantially over the past several years under sustained regulatory and competitive pressure, and the report reflects that - mobile data pricing here holds up reasonably well against peer economies. Fixed broadband hasn't followed the same curve, for structural reasons that are more about wholesale economics than any single operator's pricing decisions: fibre requires expensive physical infrastructure - trenching, ducting, per-home last-mile connections - that mobile networks largely avoid, and that capital cost gets recovered through subscriber pricing over a smaller connected base than mobile's near-universal reach.
Compared to South Africa's other SADC neighbours, the report notes the country actually performs better than most - but still trails well behind regional affordability leaders like Mauritius and the Seychelles, both considerably wealthier, smaller markets with different cost structures. The practical read for a South African household: fixed broadband affordability is a known, regulator-documented structural gap, not something you're imagining when a fibre quote feels steep relative to a mobile data bundle for the same rand spend. It's also exactly why shopping around matters more here than almost anywhere else in the household budget - see our comparison of fibre ISPs in South Africa and our cheapest fibre deals roundup for where the real price gaps between providers on the same network actually sit today.
The 13-place drop: what SA's global broadband ranking actually reflects
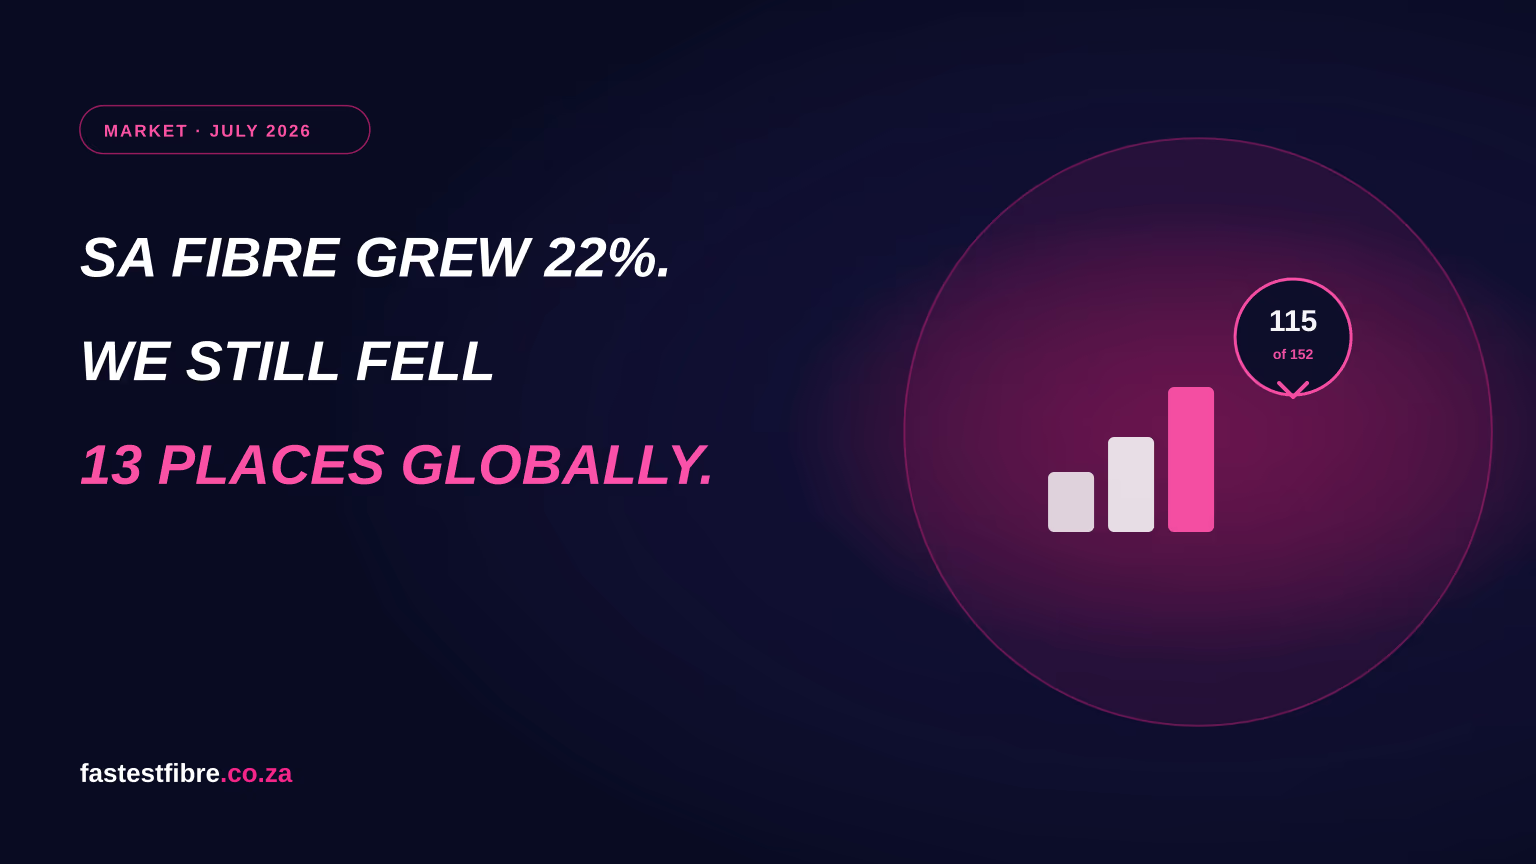
Perhaps the single most striking figure in the report is the global one: South Africa's fixed-broadband ranking fell 13 places to 115th out of 152 countries measured. That's a composite ranking - it blends affordability, speed, coverage and other quality-of-service measures rather than any single metric - which is part of why it can move even while individual numbers like subscriber growth are strongly positive.
The most direct explanation sits in the investment numbers above. Total telecommunications infrastructure investment fell for a third consecutive year, to R28.4 billion, even as fixed-network investment specifically rose. When overall sector investment shrinks while global peers keep investing, relative rankings can fall even for a market that's genuinely improving in absolute terms - South Africa isn't getting worse at fibre, but several other countries in the comparison set are getting better faster.
Infrastructure security costs are part of that investment squeeze too. Icasa's report recorded infrastructure theft and vandalism costs surging 189% in a single year, to R201.5 million reported across the sector - money that goes toward replacing stolen cable and hardened enclosures rather than new coverage. That figure sits alongside the specific, dated incidents this site has already covered - a 19-incident cable-theft weekend in Johannesburg in July and Icasa's own database plan aimed partly at fighting theft - as evidence of a genuine, quantified drag on how far operators' capital actually stretches.
| Coverage metric | Detail | Share of households |
|---|---|---|
| Homes passed by fibre networks | ~5.4 million homes | ~28% of SA households |
| Households with an actual fixed internet connection | - | ~17.4% of SA households |
| Population covered by 4G | - | 99.5% |
| Population covered by 5G (national) | - | 58% |
| 5G coverage, Western Cape vs Eastern Cape | 89% vs 7% | 31-point-plus provincial gap |
What this actually means if you're buying fibre right now
- If you've never checked coverage at your address, check again. With homes passed now at roughly 28% of households and growing 22% a year on the subscriber side, "no fibre here yet" from even a year or two ago may no longer be accurate - run a fresh check on our coverage map rather than assuming.
- Treat the affordability gap as a real, documented reason to compare hard. Icasa's own numbers confirm entry-level fixed broadband pricing here is genuinely stretched relative to income - which makes shopping across the multiple ISPs reselling the same physical network (often a R100-R200/month spread for materially the same product) worth the ten minutes it takes.
- If price is the binding constraint, look at prepaid and township-tier fibre first. Products built specifically to answer the affordability numbers in this report - see our guide to prepaid and township fibre - exist precisely because standard month-to-month contract pricing sits above what a large share of households can sustainably pay.
- Don't assume "fibre available" means "fast to install." The homes-passed/ homes-connected gap partly reflects real installation lead times and paperwork, not just affordability - our fibre installation guide covers what the process actually looks like once you've signed up.
- Expect fixed-wireless to keep gaining ground as a genuine fibre alternative. FWA's roughly 40% subscriber growth in the same report reflects operators actively pushing it into areas fibre hasn't reached - a real option worth comparing, not just a fallback, if fibre genuinely isn't available where you live yet.
Bottom line
Icasa's own data makes the fibre market's contradiction explicit rather than a matter of opinion: genuinely strong growth - 3 million-plus subscribers, up 22%, with investment shifting toward fixed networks - sitting alongside a documented affordability problem serious enough to drag South Africa's global broadband ranking down 13 places in a single year. Neither fact cancels the other out. For South African households, the practical takeaway is that fibre is more available than it was a year ago, but the price gap between the cheapest and most expensive way to get it on the same street has arguably never mattered more.
Frequently asked questions
Help someone else pick the right fibre
Now go and compare the deals
Prices below come from our own deal tracking, checked on 12 October 2026.
Ranked by price across every ISP and network we track.
See the dealsThe full catalogue in one sortable table - filter by speed, price or network.
See the dealsHow the major ISPs rank on price, support and real measured performance.
See the dealsRelated insights
SA's Fibre Underdogs Are Beating the Giants
Read article
MTN Wants to 'Own the Household'
Read article
Icasa's Fibre Database Plan and the Cable-Theft Fight
Read article
The State of Fibre Internet in South Africa 2026
Read article
Prepaid & Township Fibre Explained
Read article
Icasa's New Rollout Rules Are Out - And They Skip the Wayleave Fix Industry Asked For
Read article
Icasa Strike 2026: What It Means for Fibre Wayleave and Spectrum Rules
Read article