The Fibre Uptake Gap: Which SA Networks Actually Turn Coverage Into Customers
More than three million South African homes have fibre at the kerb and no service on it. We ranked all eight disclosed networks by uptake rate - and worked out why a low rate is a bargaining chip, not a warning.
In this article(6)
- 01Over three million South African homes have fibre at the kerb and nothing on it
- 02Every network ranked by how well it converts coverage
- 03Why the spread exists - and why low uptake is not a quality signal
- 04What the uptake gap actually means for your bill
- 05How to use uptake data when you're actually choosing
- 06Frequently asked questions
Over three million South African homes have fibre at the kerb and nothing on it
South Africa's fibre industry spent a decade measuring itself by homes passed - how many properties an operator's cable physically reaches. It is the number that gets announced, the number in the investor deck, and the number that decides whether you can order fibre at your address at all. But it is not the number that decides whether the industry is working.
The number that does is homes connected: how many of those passed properties actually have a paying service. The distance between the two is the fibre uptake gap, and on the most recent disclosed figures for the eight networks we track, it is enormous.
| Metric | Value | Detail |
|---|---|---|
| Homes passed | 6 255 318 | across 8 disclosed SA networks |
| Homes connected | 2 818 689 | paying services on those networks |
| Passed, not connected | 3 436 629 | fibre available, nobody buying |
| Blended uptake | 45.1% | connected ÷ passed, all 8 networks |
Roughly 3 436 629 households in this country can order fibre today, with no civils work, no waiting list and no coverage question - and have not. That is not a coverage problem. Every rand of trenching for those homes is already spent. It is a price, awareness and affordability problem, and it is the single biggest commercial fact in South African fibre right now.
A caveat that matters: these totals sum figures with different as-of dates (see the per-network table below), so the blended rate is an indicative industry picture, not a same-day census. Networks that have not disclosed a connected count at all are excluded from the ratio entirely rather than assumed.
Every network ranked by how well it converts coverage
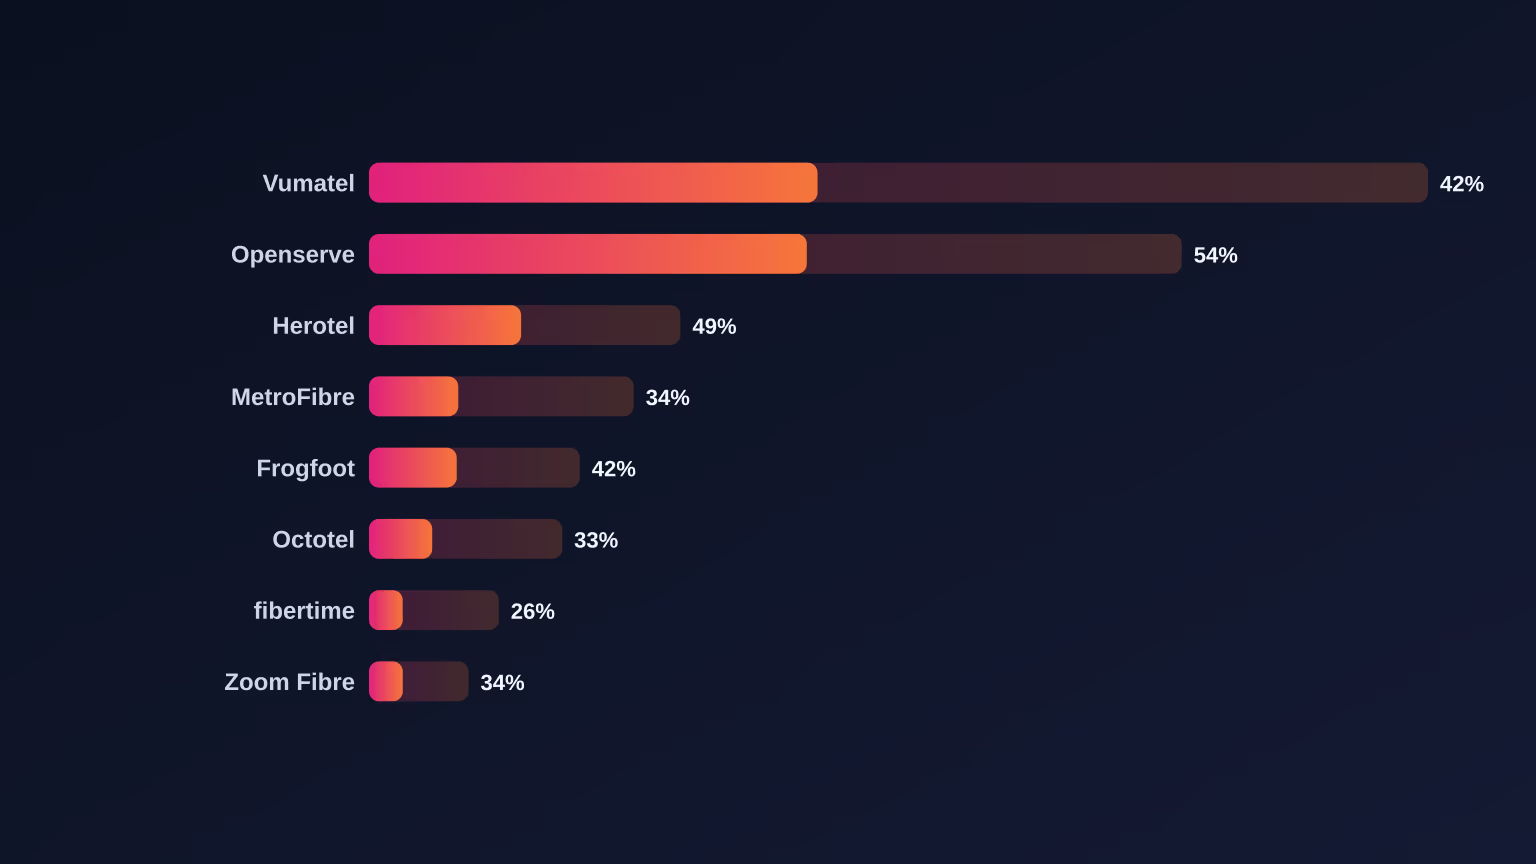
Here is every South African fibre network operator that discloses both figures, ranked by uptake rate. The pale bar is homes passed; the solid bar is the share of those homes actually connected.
| Network | Homes passed | Homes connected | Uptake | As of | Source |
|---|---|---|---|---|---|
| Vumatel | 2 339 932 | 1 032 226 | 44% | Mar 2026 | Remgro FY2026 results presentation |
| Openserve | 1 565 750 | 843 563 | 54% | Jun 2026 | Telkom Q1 FY2027 trading update, 3 Aug 2026 |
| Herotel | 620 000 | 350 000 | 56% | Jun 2026 | Remgro FY2026 results presentation (stated as floors) |
| MetroFibre | 510 000 | 172 000 | 34% | Jun 2025 | TeleGeography |
| Frogfoot | 406 000 | 169 000 | 42% | Jun 2025 | TeleGeography |
| Octotel | 372 000 | 121 800 | 33% | Jun 2025 | TeleGeography |
| fibertime | 250 000 | 65 000 | 26% | Dec 2025 | TeleGeography |
| Zoom Fibre | 191 636 | 65 100 | 34% | Jun 2025 | TeleGeography |
Herotel leads on conversion at 56.5%, and it is worth being precise about why that is impressive rather than just large: Herotel is not a small network cherry-picking dense estates. It passes 620 000 homes and still converts more than half of them.
At the other end, fibertime converts 26.0% of the homes it passes. The 30.5-percentage-point spread between top and bottom is the real headline here. These operators are selling a broadly comparable product - a fibre line to a house - into the same economy, and one is roughly twice as effective at closing the sale as the other.
The obvious read is that the low-uptake networks are worse. That is mostly wrong, and the reason is worth understanding before you use any of this to choose a network.
Why the spread exists - and why low uptake is not a quality signal
Uptake rate is not a measure of network quality. It is mostly a measure of where a network built, and secondarily of how long it has been there. Three factors dominate:
1. Where the cable went. A network that built in high-income suburbs where almost every household already wanted fibre converts quickly. A network that pushed into lower-income areas as a deliberate strategy - which several South African operators have, correctly, done - passes homes where a R500-a-month line is a genuine budget decision. Slower conversion there is the predictable cost of expanding access, not evidence of a bad network.
2. How recently it was built. Homes passed count from the day the cable goes in. Connections accumulate for years afterwards. A network in a heavy build phase is constantly diluting its own uptake percentage with fresh, not-yet-sold coverage. This is precisely why Vumatel's figure deserves context rather than a verdict - and why the context changed this year. Through FY2025 Vumatel limited homes-passed growth to 2% while subscribers grew 18.3%, a deliberate pivot from building to filling. Remgro's FY2026 results reverse that: homes passed up 15% and subscribers up 19% in the twelve months to 31 March 2026, with uptake still improving, from 42% to 44%. Read the 15% carefully, though - Remgro splits it into 7.0% organic growth plus the Vodacom fibre assets that consolidated into Vumatel during the period. The build has genuinely restarted, but it did not restart at fifteen percent.
3. How many ISPs sell it. A network is only as visible as its retail channel. An operator with dozens of competing ISPs on it gets marketed constantly by all of them; one with a handful does not.
- 31 March 2025Vumatel slows the build deliberately
Remgro FY2025 results: homes passed up just 2% to 2,040,231 while subscribers grow 18.3%. The company states it limited homes-passed growth to focus on uptake.
- 30 June 2026Openserve's connectivity rate hits 53.9%
Telkom Q1 FY2027 trading update: homes connected up 16.6% against homes passed up 10.7% - connections growing faster than coverage for the first sustained stretch.
- 13 July 2026Openserve launches its own retail ISP
The largest open-access network starts selling direct, explicitly to lift connectivity rate. Ispa, WAPA and Easttel object on open-access fairness grounds.
- 5 August 2026Telkom's CEO names the target
Serame Taukobong tells media the aim is lifting Openserve's connectivity rate from '53% to 60%' - the clearest statement yet that uptake, not coverage, is the industry's scoreboard now.
- 18 September 2026Vumatel starts building again - and keeps converting
Remgro's FY2026 annual results presentation: homes passed up 15% to 2,339,932 and subscribers up 19% to 1,032,226 in the year to 31 March 2026, lifting uptake from 42% to 44%. Remgro attributes 7.0% of the homes-passed growth and 12.4% of the subscriber growth to organic build, the rest arriving with the Vodacom fibre assets. The rare part is doing both at once: coverage and conversion usually trade off against each other.
| Date | Milestone | What happened |
|---|---|---|
| 31 March 2025 | Vumatel slows the build deliberately | Remgro FY2025 results: homes passed up just 2% to 2,040,231 while subscribers grow 18.3%. The company states it limited homes-passed growth to focus on uptake. |
| 30 June 2026 | Openserve's connectivity rate hits 53.9% | Telkom Q1 FY2027 trading update: homes connected up 16.6% against homes passed up 10.7% - connections growing faster than coverage for the first sustained stretch. |
| 13 July 2026 | Openserve launches its own retail ISP | The largest open-access network starts selling direct, explicitly to lift connectivity rate. Ispa, WAPA and Easttel object on open-access fairness grounds. |
| 5 August 2026 | Telkom's CEO names the target | Serame Taukobong tells media the aim is lifting Openserve's connectivity rate from '53% to 60%' - the clearest statement yet that uptake, not coverage, is the industry's scoreboard now. |
| 18 September 2026 | Vumatel starts building again - and keeps converting | Remgro's FY2026 annual results presentation: homes passed up 15% to 2,339,932 and subscribers up 19% to 1,032,226 in the year to 31 March 2026, lifting uptake from 42% to 44%. Remgro attributes 7.0% of the homes-passed growth and 12.4% of the subscriber growth to organic build, the rest arriving with the Vodacom fibre assets. The rare part is doing both at once: coverage and conversion usually trade off against each other. |
Put together, these explain most of the spread. A network passing newly-built coverage in price-sensitive areas through a thin ISP channel will post a low uptake rate no matter how good its fibre is. That is a commercial position, not a fault.
What the uptake gap actually means for your bill
Here is the part that affects what you pay. An operator with a large base of passed-but-unconnected homes has already spent the capital on those streets. Every month a home stays unconnected, that spend earns nothing. The marginal cost of connecting one more household on cable that already exists is small; the marginal revenue is a full monthly subscription for years.
That asymmetry is why the aggressive offers in South African fibre cluster where uptake is weakest: free installation, waived router fees, first-month-free promotions, and entry tiers priced well below what the same speed costs on a mature network. The operator is not being generous. It is converting a sunk asset.
Against the live deals we track, here is what each network's uptake position looks like next to the cheapest per-megabit price actually available on it today:
| Network | Uptake | Homes not yet connected | Cheapest R/Mbps we track | Deals tracked |
|---|---|---|---|---|
| Herotel | 56.5% | 270 000 | R5.25/Mbps | 4 |
| Openserve | 53.9% | 722 187 | R1.00/Mbps | 50 |
| Vumatel | 44.1% | 1 307 706 | R0.70/Mbps | 56 |
| Frogfoot | 41.6% | 237 000 | R1.00/Mbps | 50 |
| Zoom Fibre | 34.0% | 126 536 | R1.32/Mbps | 20 |
| MetroFibre | 33.7% | 338 000 | R1.24/Mbps | 63 |
| Octotel | 32.7% | 250 200 | R0.80/Mbps | 38 |
| fibertime | 26.0% | 185 000 | No deals tracked | - |
Uptake and homes-not-connected computed from the footprint figures above (as-of dates differ per network). Price per megabit is the cheapest download-Mbps rate across every deal we currently list on that network, recomputed at each deploy, and counts each operator's retail sub-brands with it (MetroFibre includes Metro Nexus and Metro Nova; Vumatel includes Vuma Reach). "No deals tracked" means we do not currently list retail packages on that network - fibertime, for instance, sells prepaid direct to households rather than through the ISPs we track - not that none exist.
Read the table as leverage, not as a ranking. If you live somewhere a low-uptake network reaches, you are exactly the customer that network most wants and has the most room to discount for. Ask directly about waived installation and promotional pricing before signing - and check our fibre coverage map to see which networks actually reach your address, since in much of South Africa you will have two or three options rather than one.
How to use uptake data when you're actually choosing
Uptake rate should be a tiebreaker in your decision, never the deciding factor. Price for your real household usage, and the network's track record where you live, both matter more. Use it like this:
Does the uptake gap change what you should do?
A short decision path for turning this data into an actual choice.
- Q1
Do two or more networks reach your address?
- Yes → Compare live pricing on each first. Uptake only breaks a tie between options that are already close on price and speed.
- No, only one → Uptake is irrelevant to your choice - but still worth knowing, because a low-uptake network in your area has more reason to negotiate on installation and promo pricing.
- Q2
Is the cheaper option on a lower-uptake network?
- Yes → That is usually the uptake gap working in your favour, not a red flag. Check the network's independent quality scores before deciding, then take the saving.
- No, the cheaper option is on a high-uptake network → Straightforward - take it. High uptake plus low price means a mature network competing on merit.
One thing the uptake gap genuinely does tell you: an operator sitting on 185 000 unconnected homes, as fibertime is, has every incentive to keep entry pricing keen and to keep expanding its ISP channel. That is a reasonable thing to factor into a two-year decision.
And the industry-level read is the encouraging one. 3 436 629 passed-but-unconnected homes is a large number, but it is a number that gets worked down by competition on price rather than by more capital expenditure. The most useful thing that can happen to South African fibre pricing over the next two years is exactly the fight the operators are now having over those homes.
Frequently asked questions
Help someone else pick the right fibre
Now go and compare the deals
Prices below come from our own deal tracking, checked on 19 October 2026.
What each package actually costs per megabit, not just per month.
See the dealsThe full catalogue in one sortable table - filter by speed, price or network.
See the dealsRanked by price across every ISP and network we track.
See the dealsRelated insights
SA Fibre Benchmarks: Speeds, Ratings & Prices
Read article
Openserve's Q1 FY2027 Results, Read for What They Mean for Your Fibre
Read article
Openserve vs Vumatel in 2026
Read article
Vumatel Passed One Million Subscribers
Read article